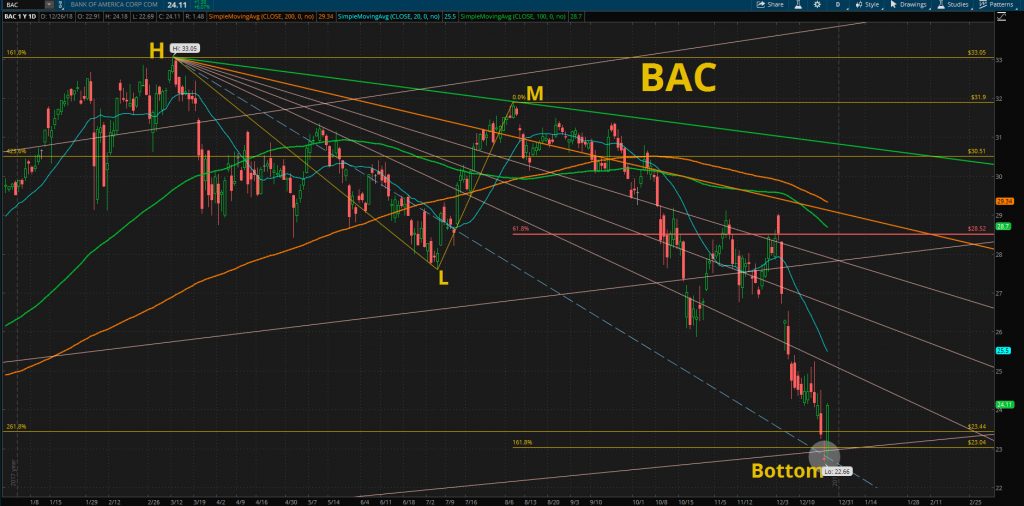
How to catch the bottom level? 1) Draw fibo fan line starting from H(ighest) to M(iddle). And tracing fibo fan blue dotted line. 2) Create fibo reverse extension by connecting H-L-M. Here we can find the area which are crossed 161.80% of H-L-M with blue dotted line. This area are possible bottom level. Also here upward fibo fan line created since 2009 works as a support. Three fibo lines work all together. FYI, when blue dotted fibo fan lines meet any 161.80%, 261.80% or 423.60%, that area may be considered as the bottom. This is the way how to discover the price bottom using fibonacci.