60 min chart. Uptrend. Target price is 338

60 min chart. Uptrend. Target price is 338
Target price is 332


10 year chart

5 year chart

2 year chart

30 min chart

5 min chart

1 min chart
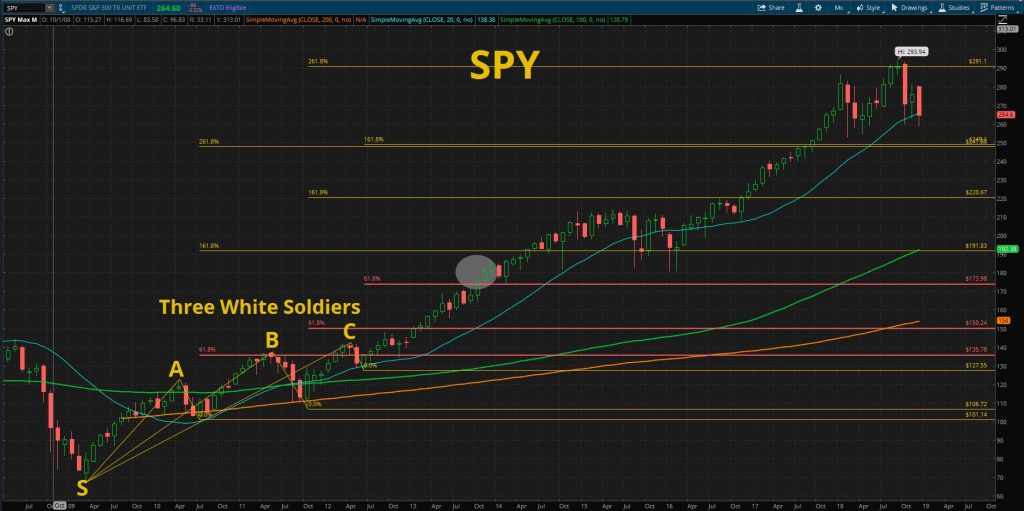
Three White Soldiers – SPY S&P 500 ETF
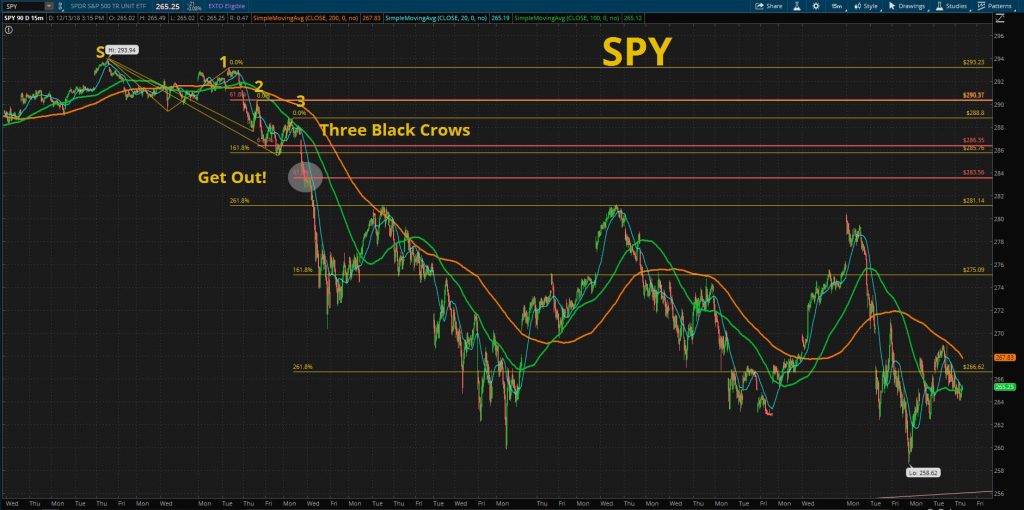
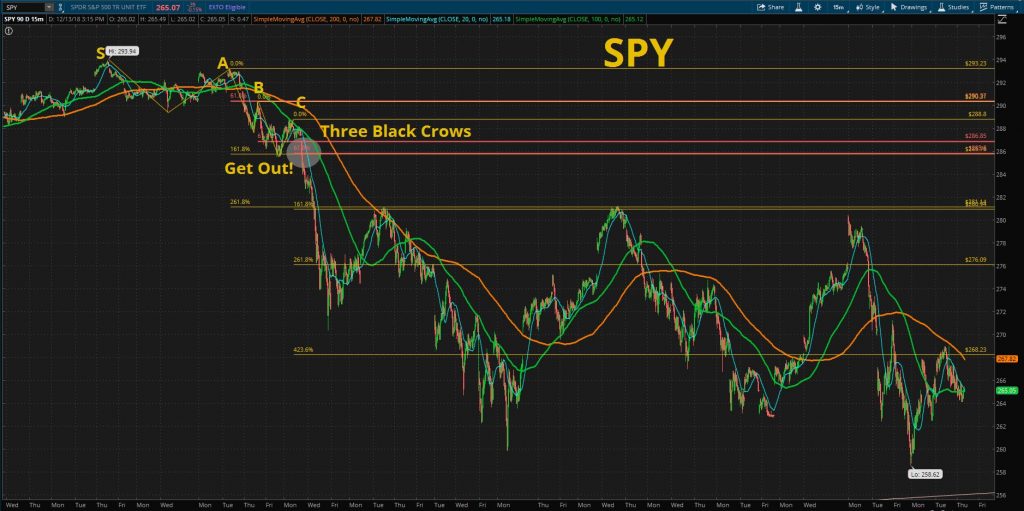
Image 1 explains the Fibo numbers come from the connection 0->1->2->3. Image 2 explains connecting S-1, S-2, S-3. Image 3 explains SPY is not reached 423.60%,about level 325?. This means current market down is adjustment, not drop without hope. Circled marks in Image 1 & 2 means get in point using three white soldiers. Like this, we can apply to find get out point using three black crows.


The most difficult thing in technical analysis is to maintain objectivity. Depending on the time frame, the results may be different. For example, the 1-year chart is up, but the 10-day chart is down. It is a question of which standards should be set. The only thing that can be free about this headache is the use of three white soldiers and three black crows. As a shot-term swing trader, I use mainly a 15-minute chart. Please see images for explaining get out idea if three black crows formed. You can see that the method of connecting the A-B-C in image 2 recommends selling at a higher point.

