
Macro view. Target price is 1.25/423.60% and check current support levels.
Macro view. Target price is 1.25/423.60% and check current support levels.

Macro view. Hit the historical bottom.

15 min chart. Uptrend and 18.3 has double resistance. When over this, this will go to next target 20/61.80%.

Target price is previous high, 190.67/423.60%. Actual target price is really high and I will check later how far this can go.

Macro view. Target price is 188 but we need to discuss urgent matter. 106/61.80% is next support level.

15 min chart. Check support levels.

Down trend and check below support levels.

5 min chart. Need to go over 0.786 downward resistance fan line. Near target is 16.14

Target price is 60/423.60%.

Need to check two numbers. 0.86/423.60% is expected bottom of this fall. 0.91/61.80% is 61.80% of upwave. Now 0.92 stayed slightly over 0.91. Good. Those number are critical support levels. Also 1.3/161.80% is important level for going high and FYI target price of this is 2.315/423.60%. In short, this stock is staying at bottom level and need go inside of 0.786 uptrend support line.

Stopped at double support level at 65. Target price will be 90/423.60%. If support fail this will go down next support level at 50.

15 min chart. Uptrend. If fall, check below support levels.

1.817/423.60% of 2nd Upwave. Will see this number.
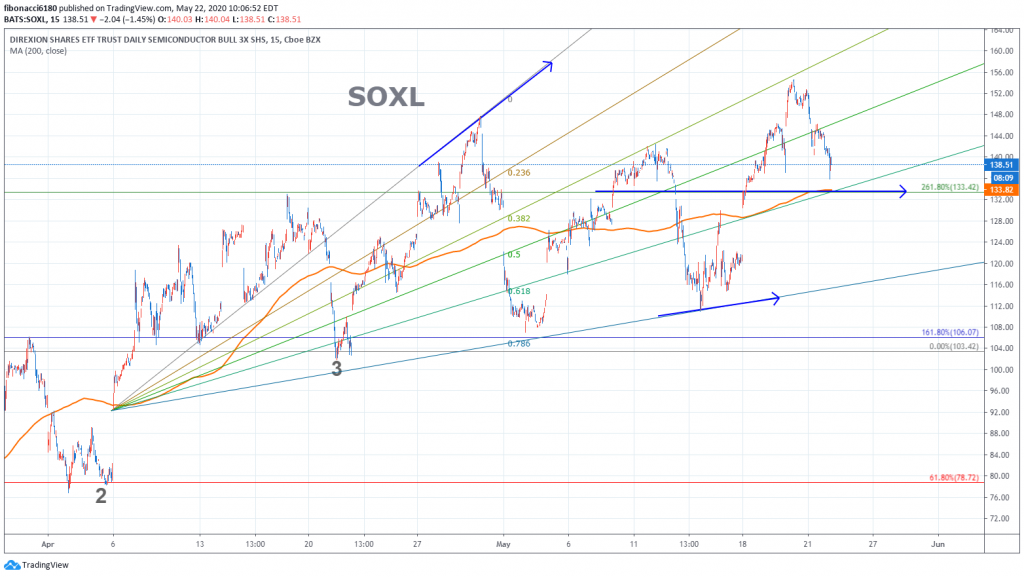
Slingshot pattern created and critical support level is 133.