Skip to content
fibonacci6180

fibonacci6180

Fibonacci Technical Swing Trade

  • Futures
  • ETFs
  • US Stock
  • Forex
  • Crypto Currency
  • Learn Fibonacci Analysis

Tag: US Stock

Chart Analysis – SPY

SPY formed three white troops. And very important support level is 243.66/61.80% of 3rd wave.

I found many of three white troops pattern on last days and this is good for long position holder.

S&P 500 ETF

Author fibonacci6180Posted on December 28, 2018November 19, 2019Categories US StockTags nasdaq, S&P 500 ETF, US StockLeave a comment on Chart Analysis – SPY

Chart Analysis – Amazon

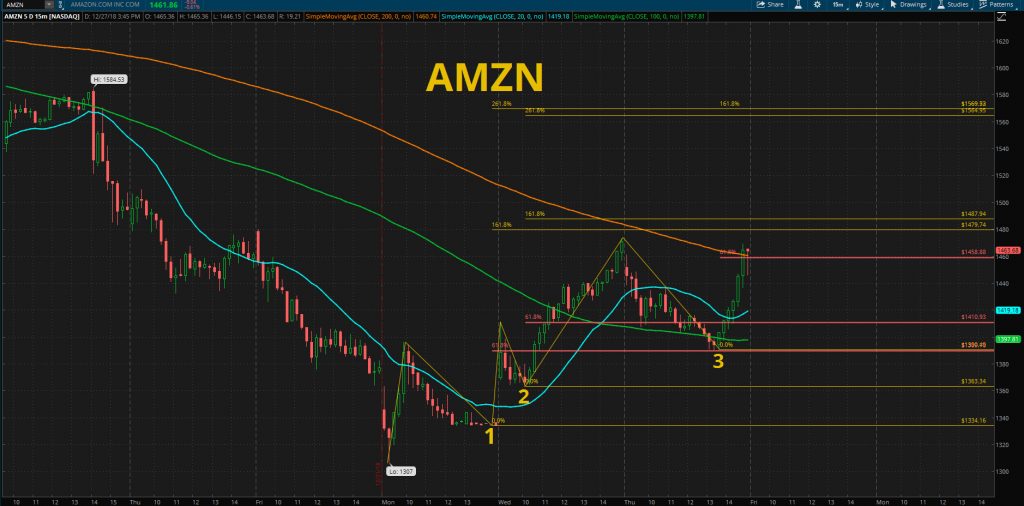
Three white troops created and stay over 61.80% of 3rd upwave.

Amazon stock chart

Author fibonacci6180Posted on December 27, 2018November 19, 2019Categories US StockTags amazon, amazon stock chart, US StockLeave a comment on Chart Analysis – Amazon

Chart Analysis – UVXY

At last, hit the big resistance downtrend line. Good sign for #DOW

UVXY CHART

UVXY CHART

Author fibonacci6180Posted on December 26, 2018November 19, 2019Categories US StockTags cboe, stock chart, US Stock, uvxy, vixLeave a comment on Chart Analysis – UVXY

Chart Analysis – Apple

Today 261.80% support line was collapsed. The strength of vix is so strong that it is inevitable reality.

The good news for expecting is now approaching orange colored fibo upward line has created since 2004. In keeping with its history, this line has a very strong supporting role.

apple stock chart

Author fibonacci6180Posted on December 24, 2018November 19, 2019Categories US StockTags apple, faang, nasdaq, US StockLeave a comment on Chart Analysis – Apple

Chart Analysis – UVXY

Next resistance will be orange colored downtrend line or 96.94/161.80% of 2nd upwave.

UVXY stock chart

Author fibonacci6180Posted on December 24, 2018November 19, 2019Categories US StockTags cboe, stock market, US Stock, uvxy, vixLeave a comment on Chart Analysis – UVXY

Chart Analysis- Disney

Yesterday’s low reached the doubled support point. When falling below this point, 103/61.80% of this year’s wave is next support level. 103 is considered to be the most likely low point.

disney chart

disney chart

disney chart

Author fibonacci6180Posted on December 23, 2018November 19, 2019Categories US StockTags disney chart, US Stock, walt disneyLeave a comment on Chart Analysis- Disney

Chart Anaylsys – Netflix

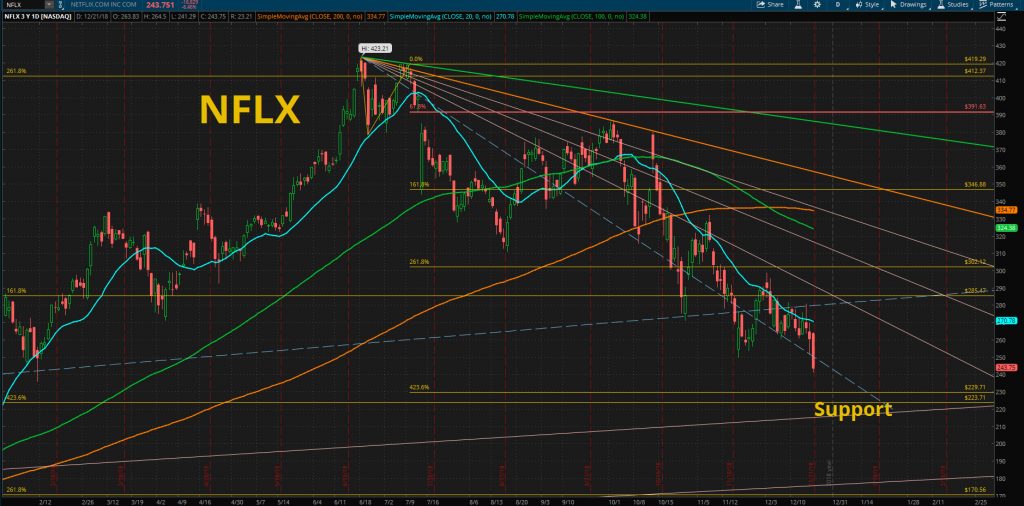
Next support will be 229/423.60% of down wave or 223/423.60% of previous up wave.

Netflix stock chart

Author fibonacci6180Posted on December 21, 2018November 19, 2019Categories US StockTags netflix, nflx, US StockLeave a comment on Chart Anaylsys – Netflix

Chart Analysis – NIKE

Nike smashes expectation, stock surges!
Tomorrow’s topped price will be 74.1/423.60%.

NIKE STOCK

NIKE STOCK

Author fibonacci6180Posted on December 20, 2018November 19, 2019Categories US StockTags NIKE, US StockLeave a comment on Chart Analysis – NIKE

Chart Analysis – TLRY

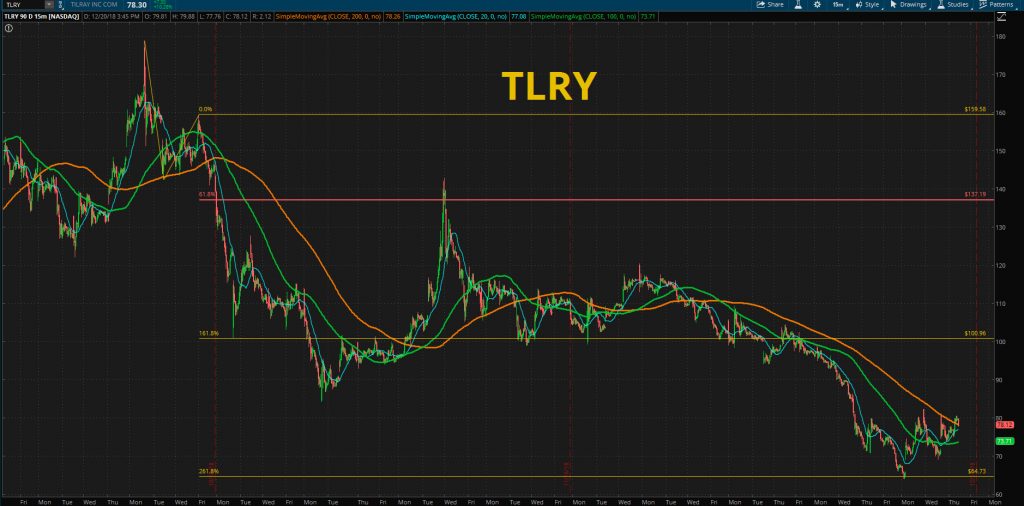
64.73/261.80% was a main support level. And 80.69/61.80% of 1st up-wave is a resistance level. If go above, next target is 99.10/161.80%.

tlry chart

tlry chart

Author fibonacci6180Posted on December 20, 2018November 19, 2019Categories US StockTags cann, Cannabis Stocks, cron, nbev, TLRY, US StockLeave a comment on Chart Analysis – TLRY

Chart Analysis – TWTR

Orange colored fibo line will work as a support. Expected support level will be 27.80 ~ 28.

twitter stock chart

Author fibonacci6180Posted on December 20, 2018November 19, 2019Categories US StockTags twitter, TWTR, US StockLeave a comment on Chart Analysis – TWTR

Posts navigation

Previous page Page 1 … Page 17 Page 18 Page 19 … Page 21 Next page

Ticker Search

Learn Fibonacci 6180 technique

FIBO SLINGSHOT & EXTENSION 080220

https://youtu.be/crTq0s5wDzA

Tag Cloud

  • 61.80%
  • aapl
  • amazon
  • amd
  • amzn
  • apple
  • BA
  • bitcoin
  • BOEING
  • btcusd
  • CCL
  • CDEV
  • costco
  • crude oil
  • crypto
  • facebook
  • FAS
  • fb
  • fibonacci
  • fibonacci extension
  • fibonacci retracement
  • GENIUS BRANDS
  • gnus
  • GOLD
  • google
  • Microsoft
  • msft
  • nasdaq
  • natural gas
  • netflix
  • nflx
  • PHARMA
  • qqq
  • roku
  • s&p 500
  • spy
  • tesla
  • tsla
  • tvix
  • US Stock
  • uvxy
  • vix
  • wells fargo
  • wfc
  • 피보나치

Recent Posts

  • Hub Group Chart Fibonacci Analysis 101625
  • Anika Chart Fibonacci Analysis 101525
  • Whitehawk Chart Fibonacci Analysis 101525
  • TUHURA BIOSCIENCES Chart Fibonacci Analysis 101525
  • AZENTA Chart Fibonacci Analysis 101525

US Stock

  • Hub Group Chart Fibonacci Analysis 101625 October 16, 2025
  • Anika Chart Fibonacci Analysis 101525 October 15, 2025
  • Whitehawk Chart Fibonacci Analysis 101525 October 15, 2025
  • TUHURA BIOSCIENCES Chart Fibonacci Analysis 101525 October 15, 2025
  • AZENTA Chart Fibonacci Analysis 101525 October 15, 2025
  • ENHABIT Chart Fibonacci Analysis 101525 October 15, 2025
  • Cardinal Health Chart Fibonacci Analysis 092625 September 26, 2025
  • Best Buy Chart Fibonacci Analysis 092625 September 26, 2025
  • Enphase Energy Chart Fibonacci Analysis 092625 September 26, 2025
  • Clearfield Chart Fibonacci Analysis 092625 September 26, 2025

Korean Stock

    Subscription

    Get new posts by email
    • Futures
    • ETFs
    • US Stock
    • Forex
    • Crypto Currency
    • Learn Fibonacci Analysis
    fibonacci6180 Proudly powered by WordPress