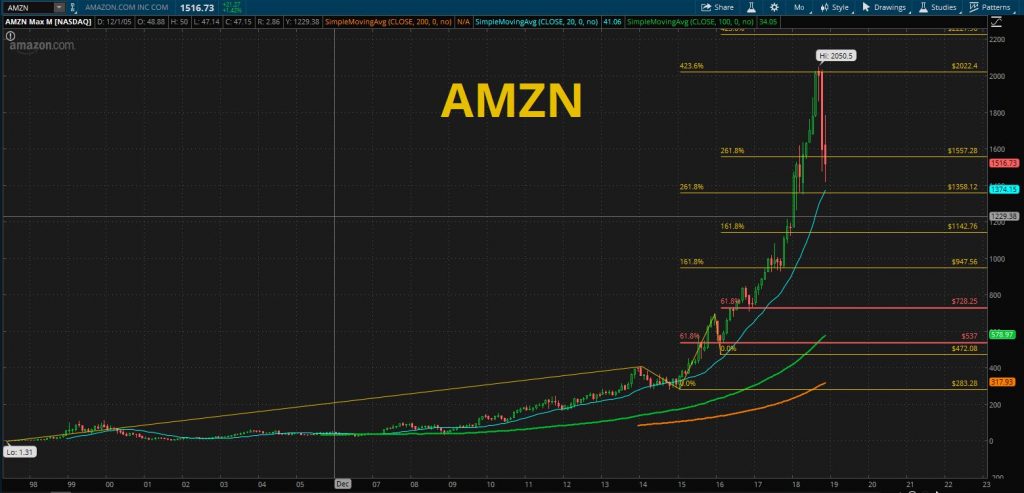
Target price is 2841/423.60%.

Target price is 2841/423.60%.

Target price is 2708/423.60%.

Macro view. Target price is 2841/423.60%.

Near target price is 2721/423.60%.

Macro view. Hit the resistance fan line.

Red alert! Hit the 423.60%.

2347 is support level.

Now in danger. Check support zone 2336/61.80% ~ 2347

Target price is huge. Right now looks tired.
아마존은 이미 423.60%을 두번이나 경험을 했고 현재는 1737를 기준으로 우횡보중입니다. 상승 3파가 형성이 되어 있지만 3파째는 약합니다. 3파의 최저점을 지키는데 주력을 할 필요가 있겠습니다.

Support levels are : 1647. If fail, next support is 1583.6.

Fail again, follows are support levels : 1565, 1547(261.80%),1320, and 1246(423.60%)

Next supports are 1358 / 1242, 423.60%


The circle, 1420 level will be working as a support.
