The most difficult thing about the stock chart analysis is that the results vary greatly depending on the reference point. Because the stock signals are very delicate, misapplication of the reference point can lead to large errors in interpretation. Good standards can give good results. However, bad or ambiguous standards only add to the pain of analysis. Many stock traders have spent a tremendous amount of time and effort trying to find those standards. As one of them, I also spent a lot of time in standardizing the Fibonacci technical analysis. I am working to increase the certainty of the analysis.
Generally speaking, the starting point of Fibonacci extension is to use the lowest point of the chart regardless of time frame. And one more thing, the ideal lowest point is starting from under SMA20, SMA100 and SMA200 curves. If the lowest point on the screen is placed above the SMA lines, try not to create a Fibonacci extension. Charts on the screen you use vary greatly in time frame. For example, from the 5 Min/Day to the 1 Mon/10years. If we start anywhere from the lowest point on the chart, we will see a lot of extensions, and the screen will be really dizzy in our view.
The chart below shows the Fibonacci targets by linking the minimum and maximum values of each stock wave from the last 10 years to the last year 2017 in yearly base. This is so complicated that no body like this.

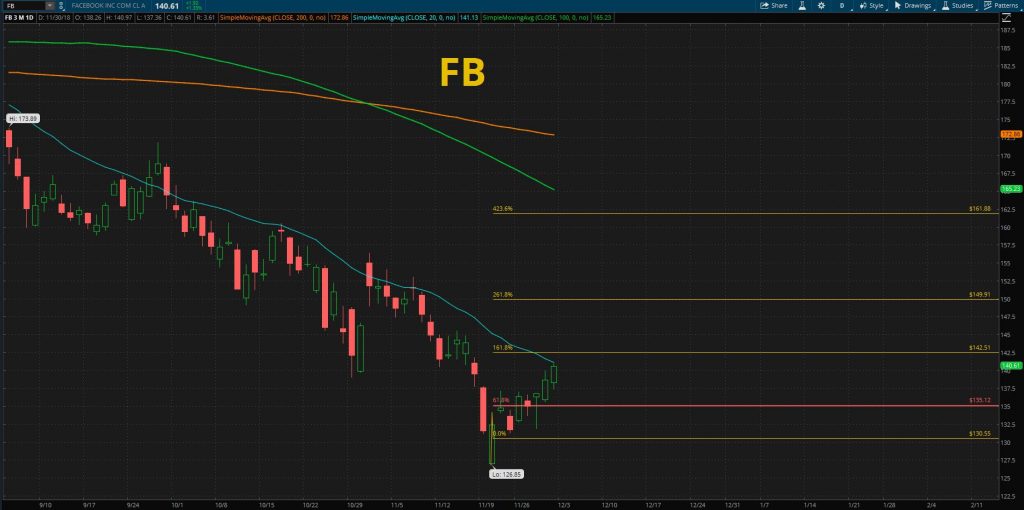
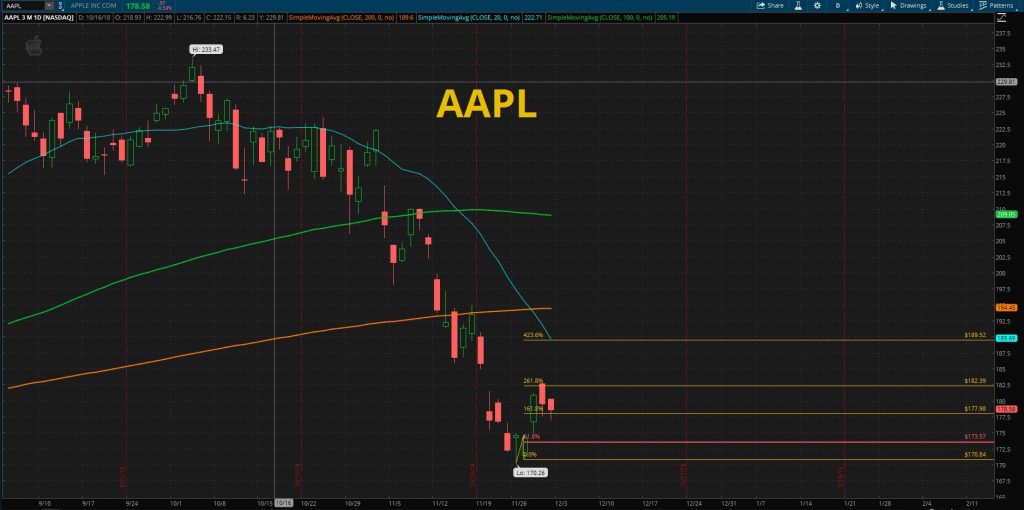
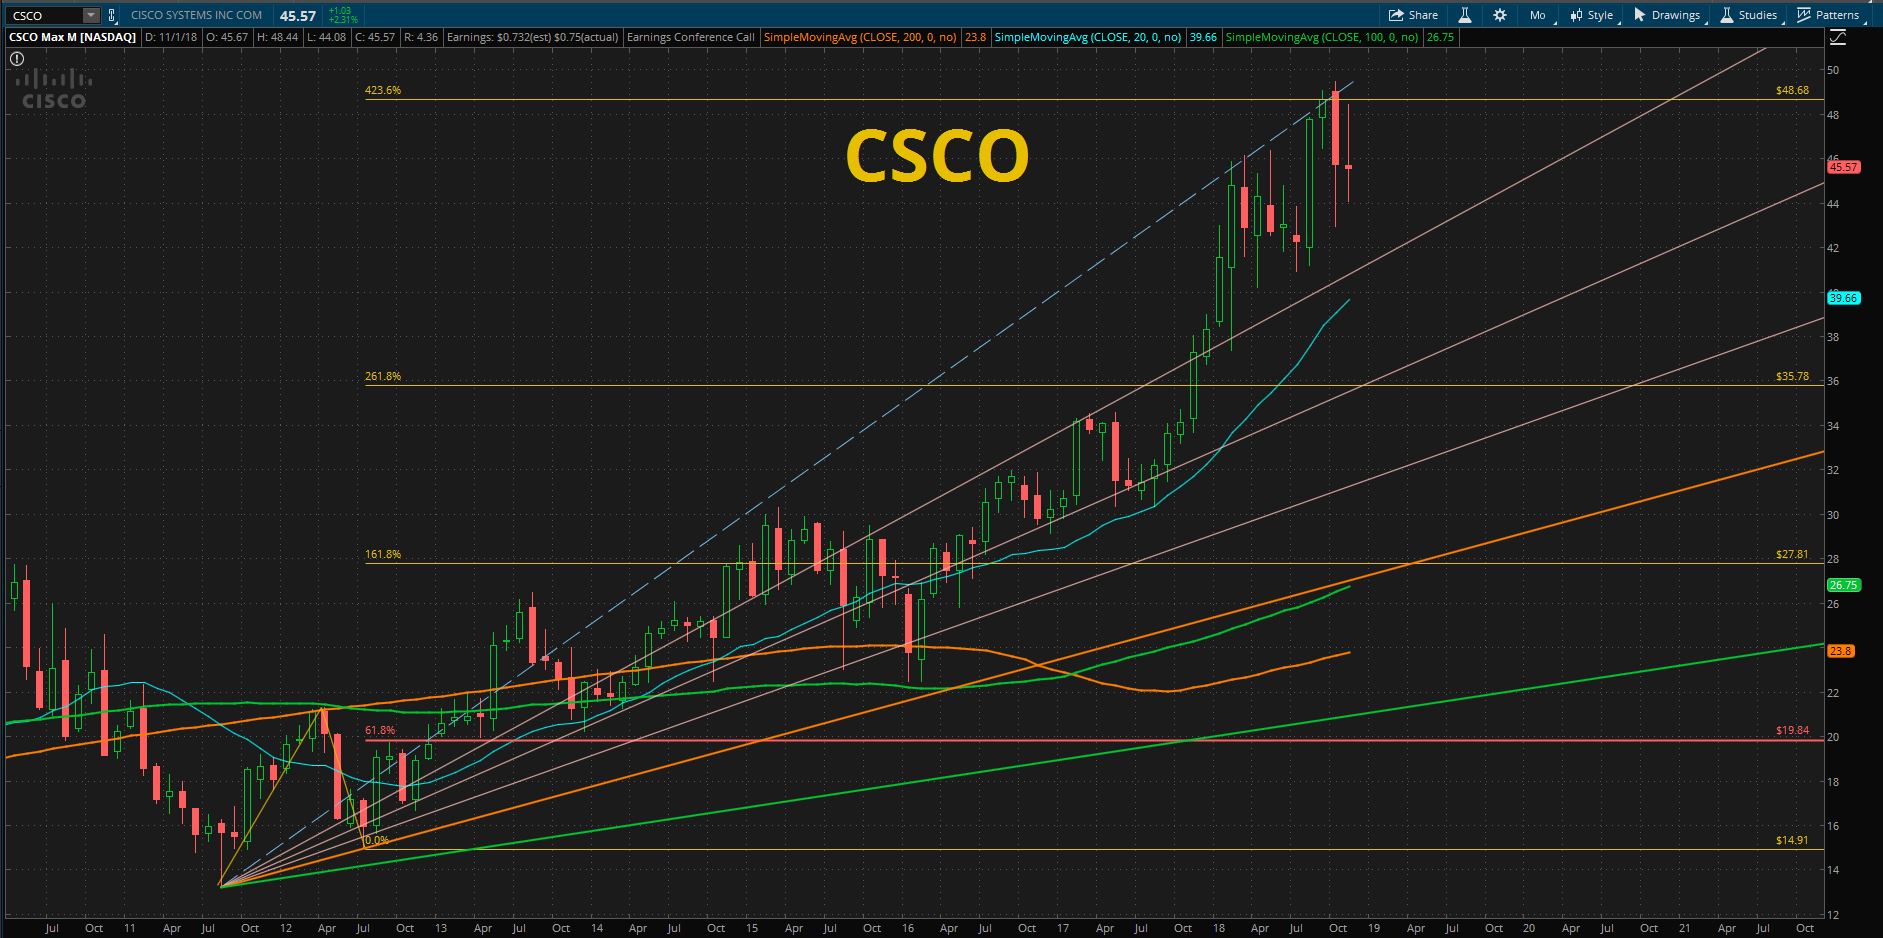
Let’s see that start at the point under SMAs. The following chart is the past five years.

From this below chart, we can get an idea that the maximum value from this extension is 229.96. And we can find another dip point on February 2018. Let’s make related Fibonacci extensions for this.

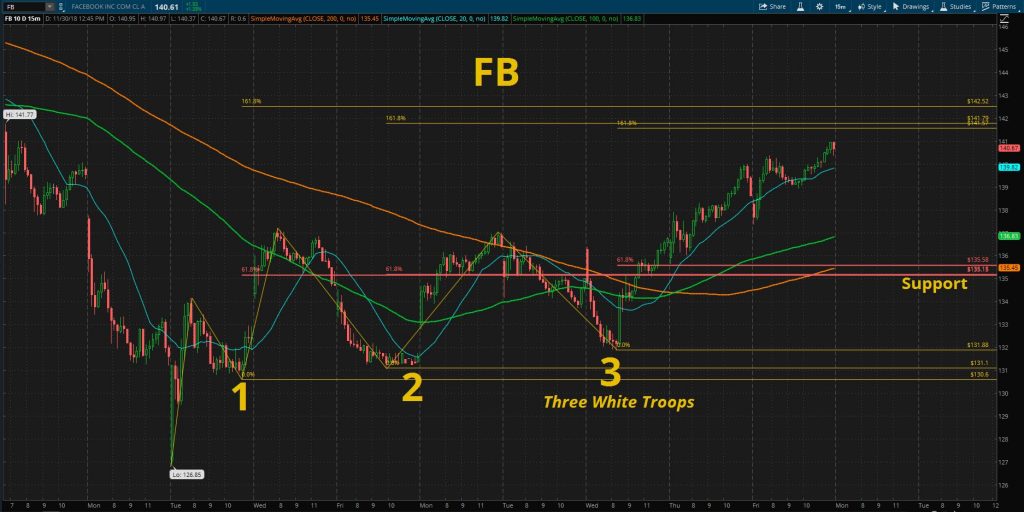
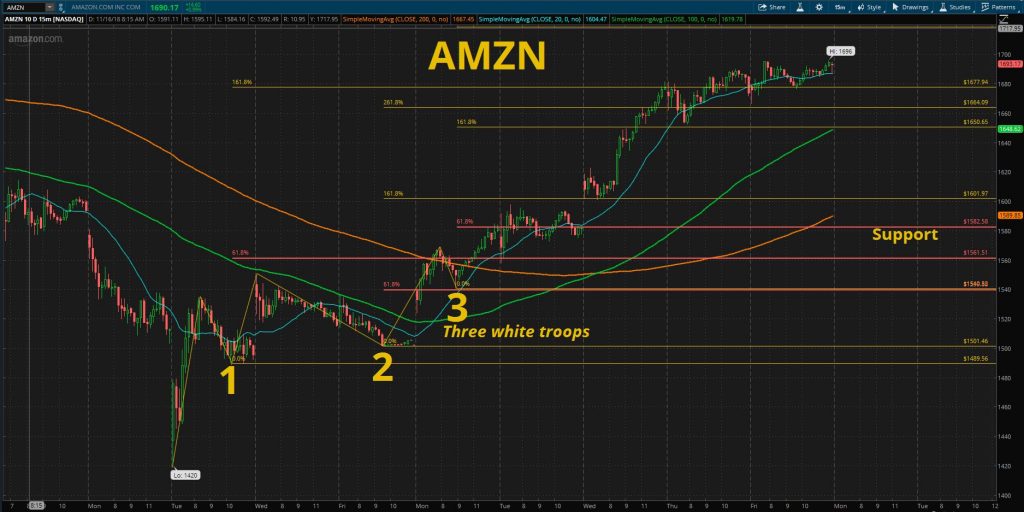
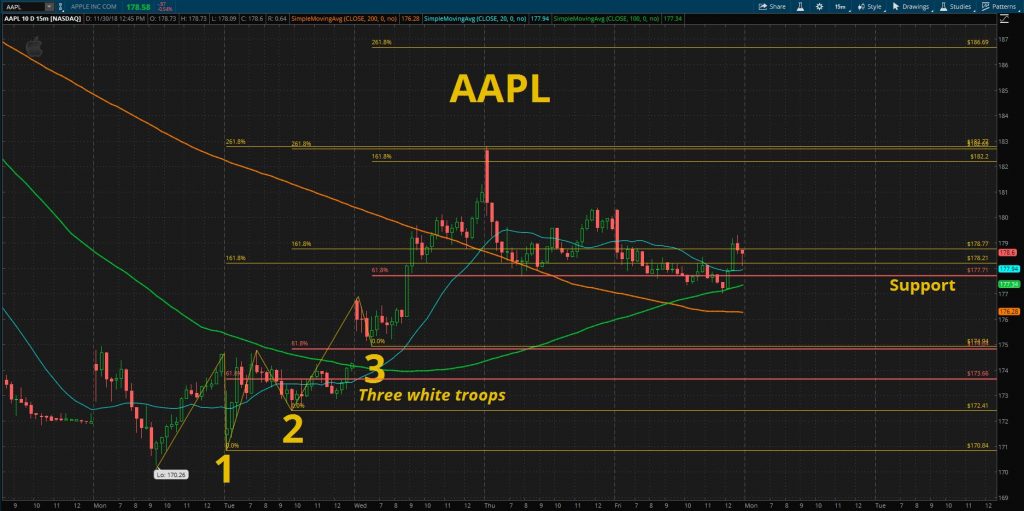
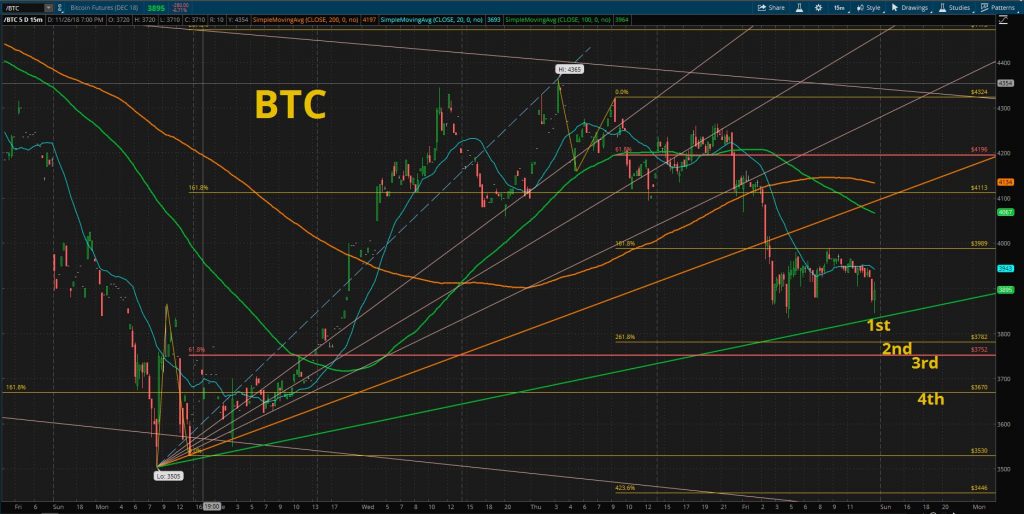
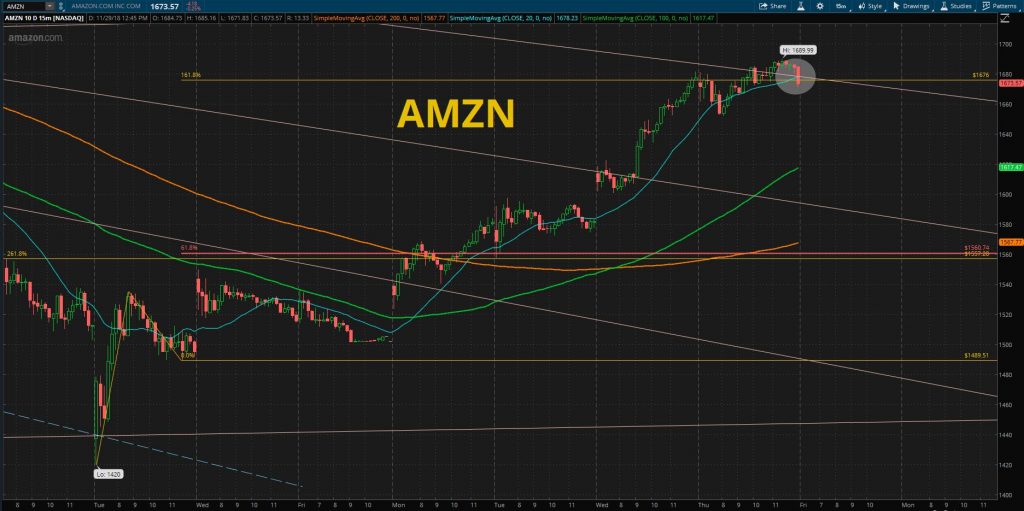
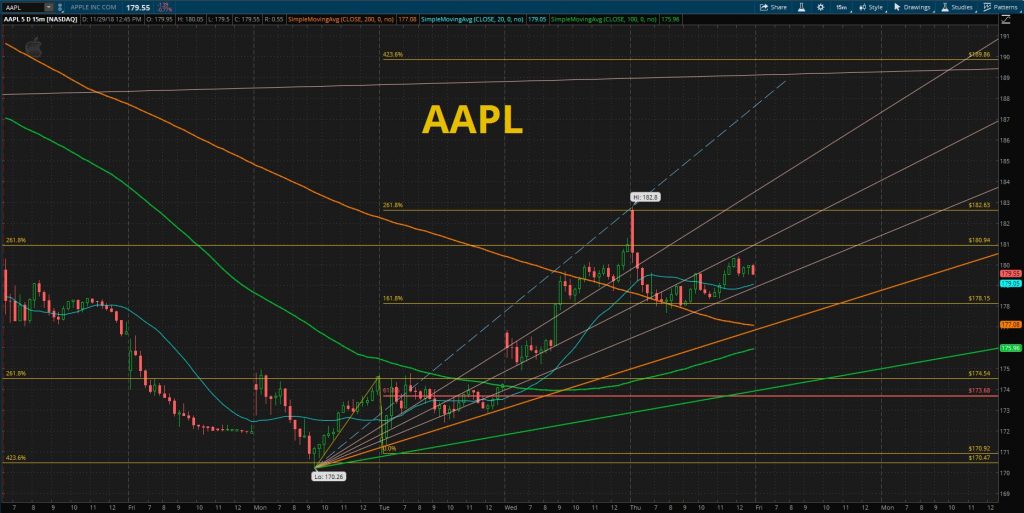
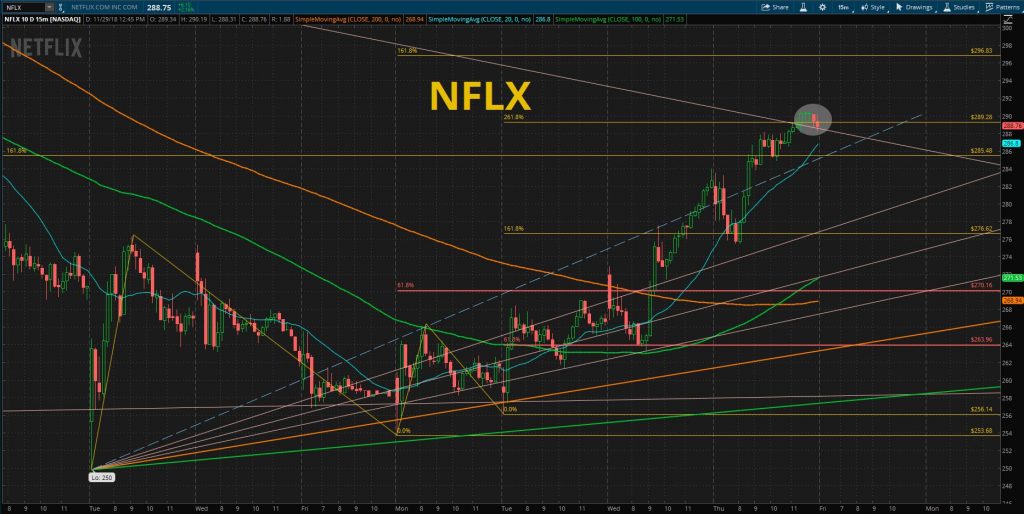
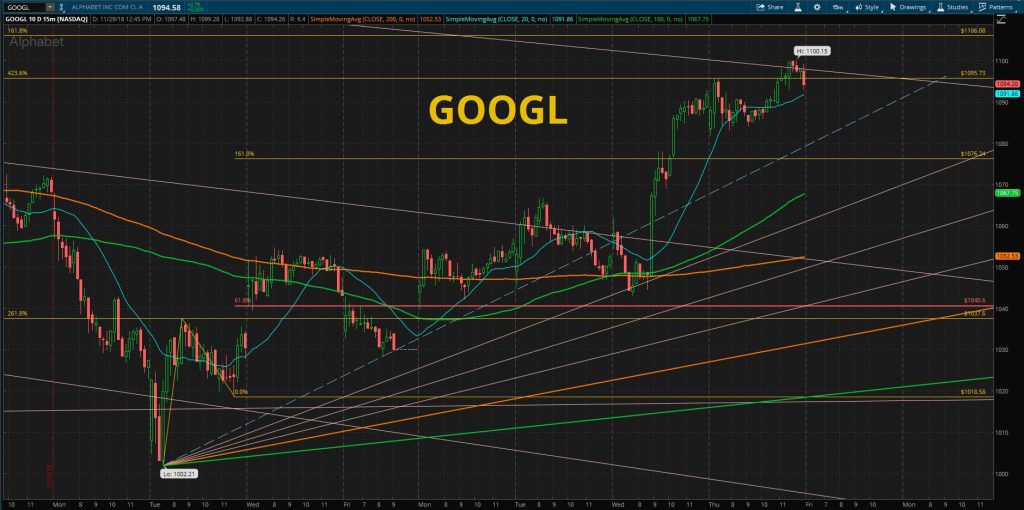
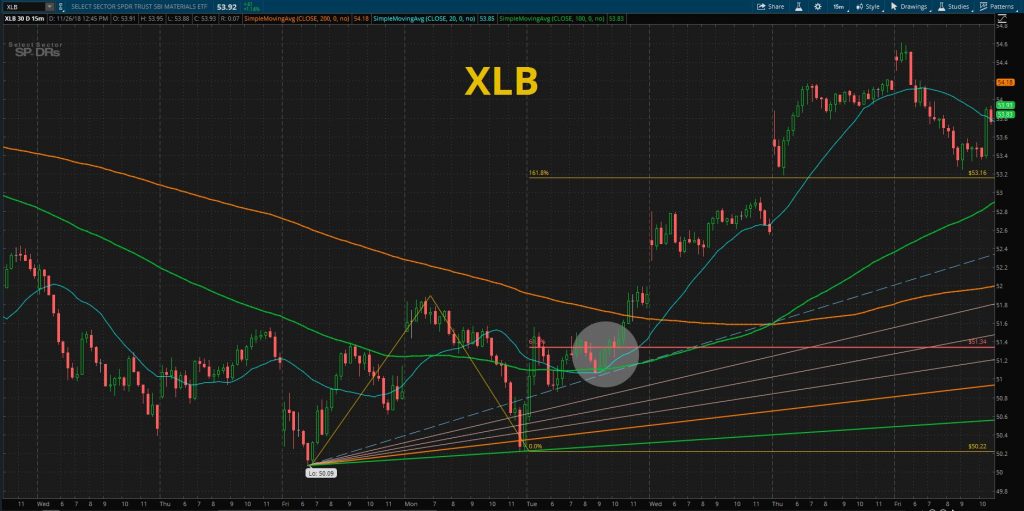
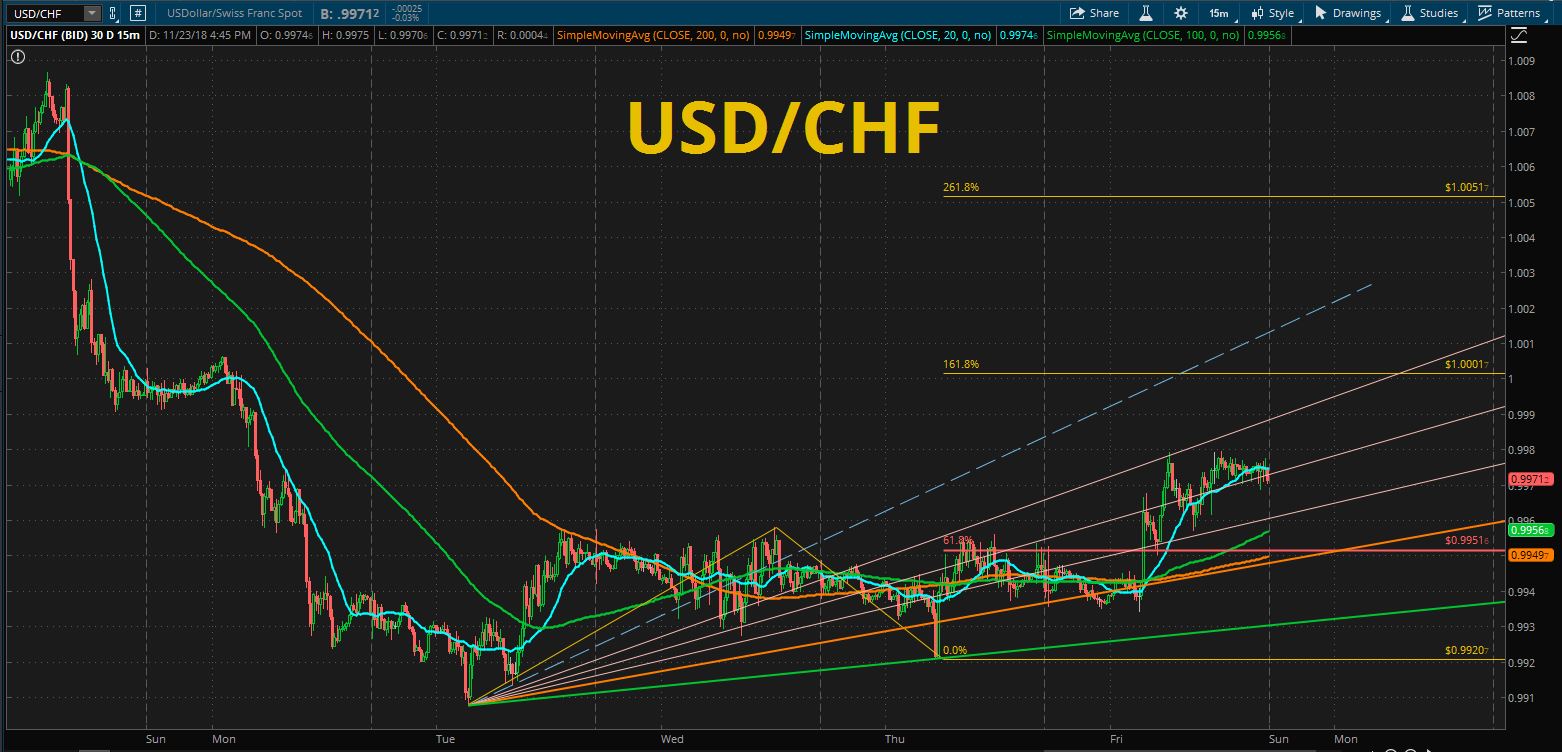
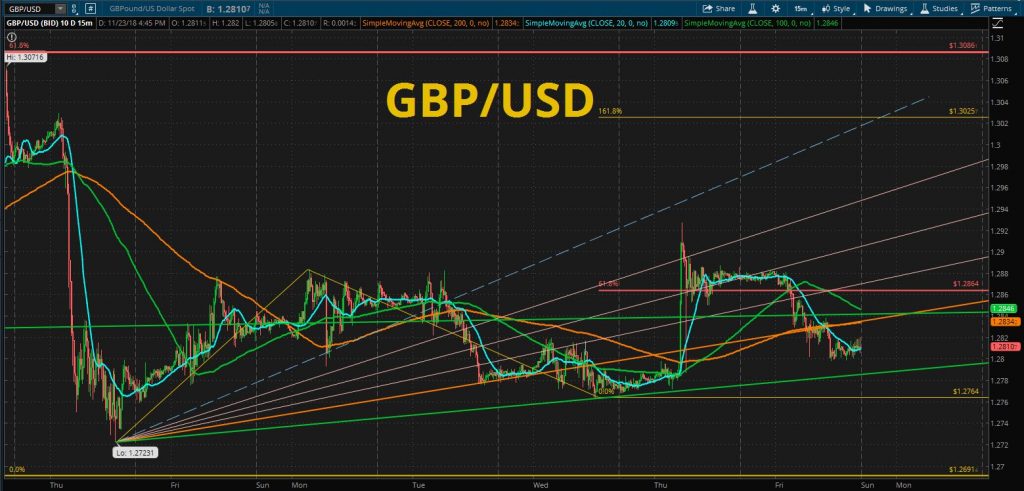
We can get an idea that the bottomed line of Fibo fan can be a defense point to the recent falling. In this way, it is much simpler to do Fibonacci analysis on any time line chart using the start point under the SMA curves. Even small time frame like 1 Min or 5 Min chart, we can apply this concept to those chart and this may better than any starting point which is placed over some SMAs.
Establishing a clear standard of chart analysis is a way to win in an uncertain market.