Next support level is 470/61.80%.

Next support level is 470/61.80%.

Macro view. Target price is much high!

Target price is 477/423.60%.

Bottom price of 2nd downwave is 398/423.60%.

Fibo slingshot pattern created. Uptrend.
261.54 – Three white troops level. 61.80% of 3rd up wave.
S(230)-2nd up wave starting (239.94) => 347.43/423.60% of this wave. 347.43 is also today’s support.
S(230)-3rd up wave starting (249.74) => 371.93/423.60% of this wave.
So 371.93 or green colored fibo downtrend line will be a possible topped price on this up moving.
After then, below green colored fibo fan line will work as a support.


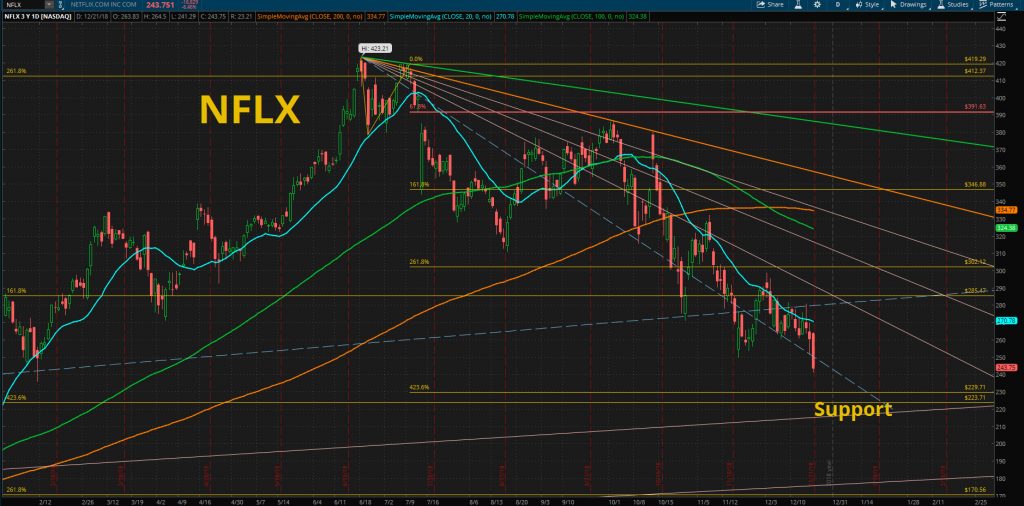
Next support will be 229/423.60% of down wave or 223/423.60% of previous up wave.

There is a possibility to go down to circle point 260.
